
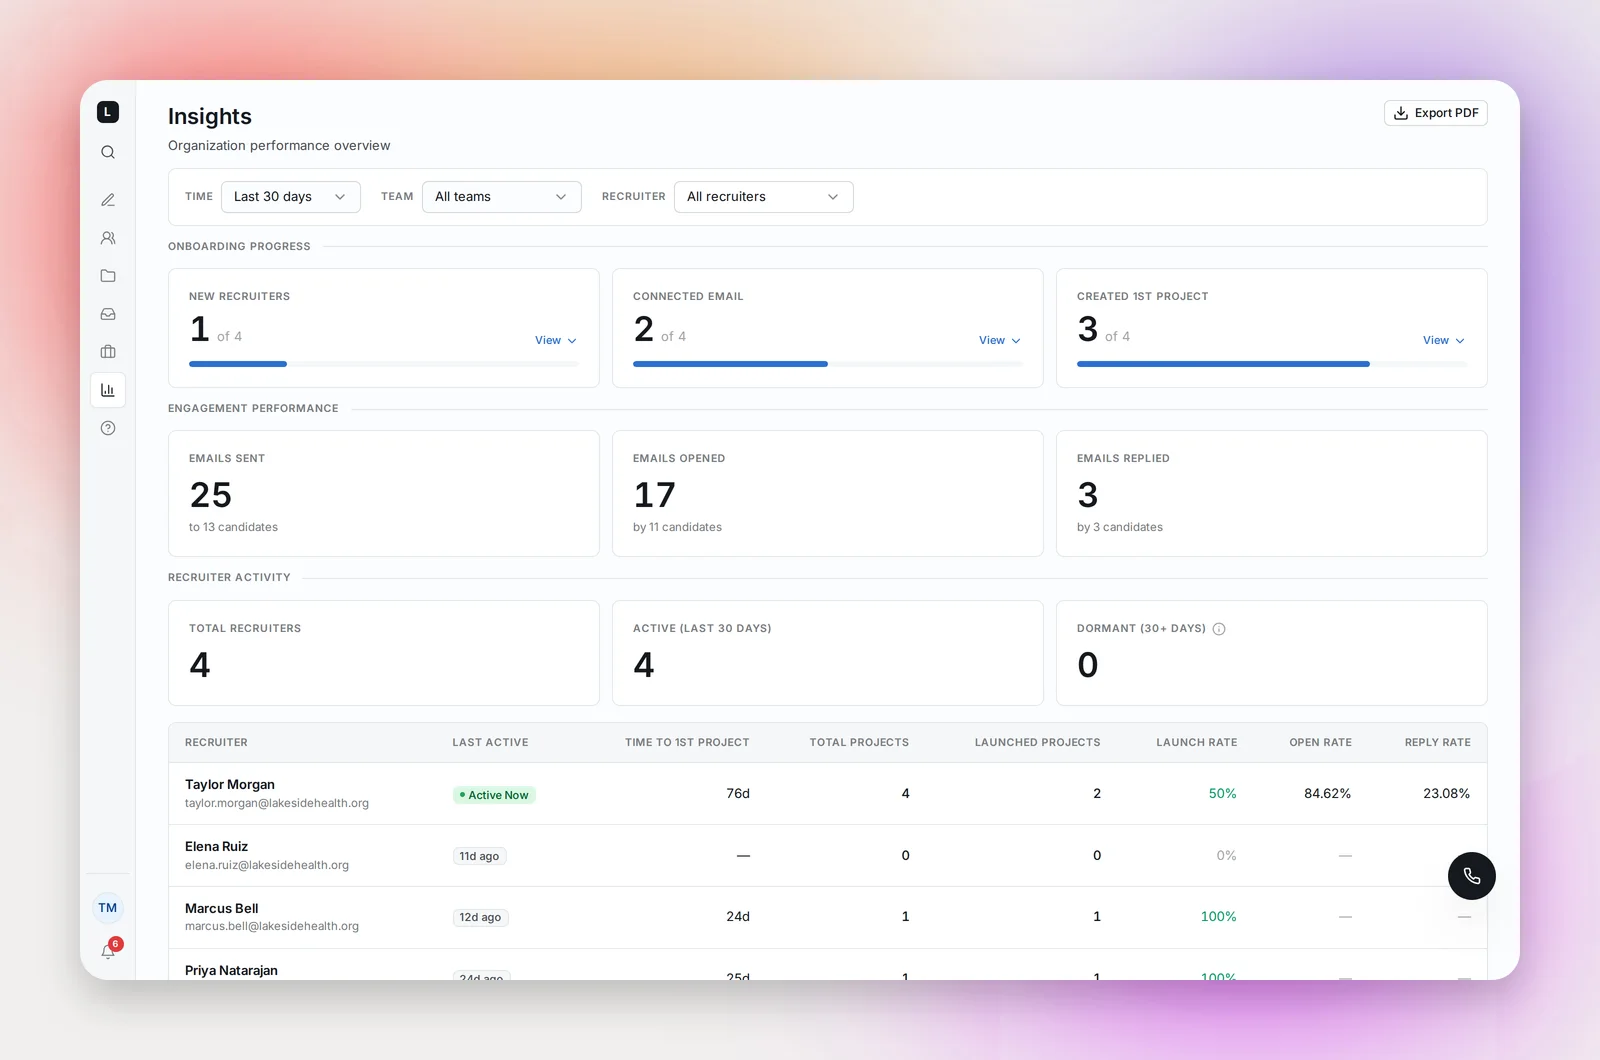
Insights in the sidebar is the view of the whole workspace: who has set up, who is active, and how outreach is performing.
Filters
- Time: last 7, 30 or 90 days, all time, or a custom range
- Team: all teams or one
- Recruiter: one person, when your workspace has more than one member
Sections
- Onboarding Progress: three cards out of your total recruiters, New Recruiters (joined in the selected period), Connected Email and Created 1st Project, each with a list of who has and who hasn't. Amber notes call out the gaps ("3 recruiters need to connect email"). The whole section disappears once all three cards are complete.
- Engagement Performance: emails sent, opened and replied, each with the number of candidates behind it.
- Recruiter Activity: total recruiters, active in the last 30 days, and dormant (no project created or launched in 30 days).
- Recruiter table: per person, last active, time to first project, total and launched projects, launch rate, open rate and reply rate. Sort and expand to see everyone.
- Charts: projects created and launched, and the launch rate, per day for ranges of 14 days or less and per week otherwise.
- Agent Activity: Total Projects, Launched Projects and Dormant Projects (created in the period but not yet launched, as a percentage); a Sourced, Messaged, Opened, Replied funnel; an Agent Performance by Team chart (sourced, emailed and replied per team); and a per-project table with Project, Recruiter, Created, Sourced, Messaged, Open Rate and Reply Rate.
Export PDF
The button at the top produces an A4 PDF named betterleap-insights- with the filters you chose printed at the top, every section in full (tables expanded, charts full width) and a "Proprietary & confidential" footer. It's built for a weekly leadership update or a QBR.
Frequently asked questions
Why doesn't a recruiter appear?
They haven't signed in yet, or they're on a different team from the one selected. Check Settings → Team & roles.
Are the rates the same as on a project's Overview?
Same definitions, aggregated across every project in the filter: opens and replies counted per candidate.
Can I schedule the PDF?
Not currently. Export it when you need it; it takes a few seconds.
Why does Time to 1st Project show a dash?
It and Created 1st Project count only projects created in Betterleap. A recruiter whose projects were all migrated from a previous system shows a dash until they create one here.
Why did a recruiter's numbers change after a project transfer?
Insights credits a project's whole history to its current owner, not to whoever created it. When a project is transferred, its past candidates, sends and replies move to the new owner's numbers.