
The Overview tab
Choose a date range (all time, last 7 or 30 days, or custom). The cards show the candidate pool the search matched (agent projects), candidates in project, and emails sent with how many candidates received one.
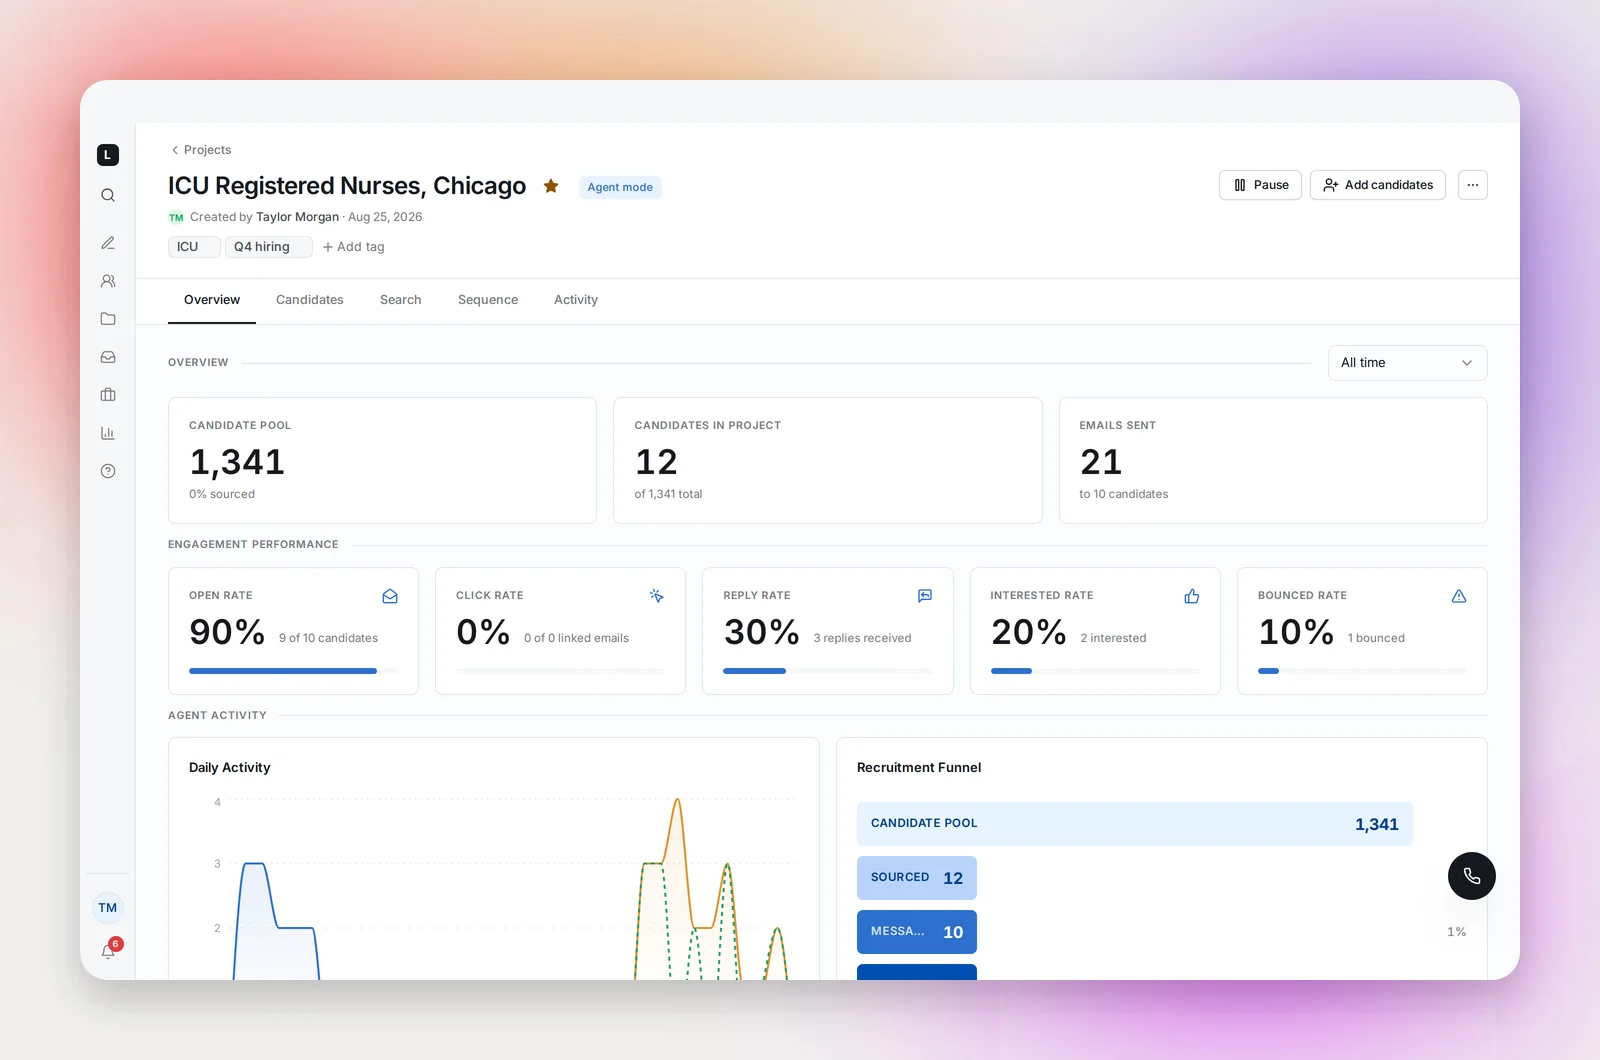
Engagement Performance gives five rates, each as a share of candidates rather than of emails:
- Open rate: candidates who opened at least one email
- Click rate: candidates who clicked a link, out of those sent an email containing one
- Reply rate: candidates who replied
- Interested rate: candidates whose reply was tagged Interested
- Bounced rate: candidates whose address bounced
Agent Activity charts daily sourcing and sending, and the Recruitment Funnel runs Candidate Pool → Sourced → Messaged → Opened → Clicked → Replied.
Per step and per candidate
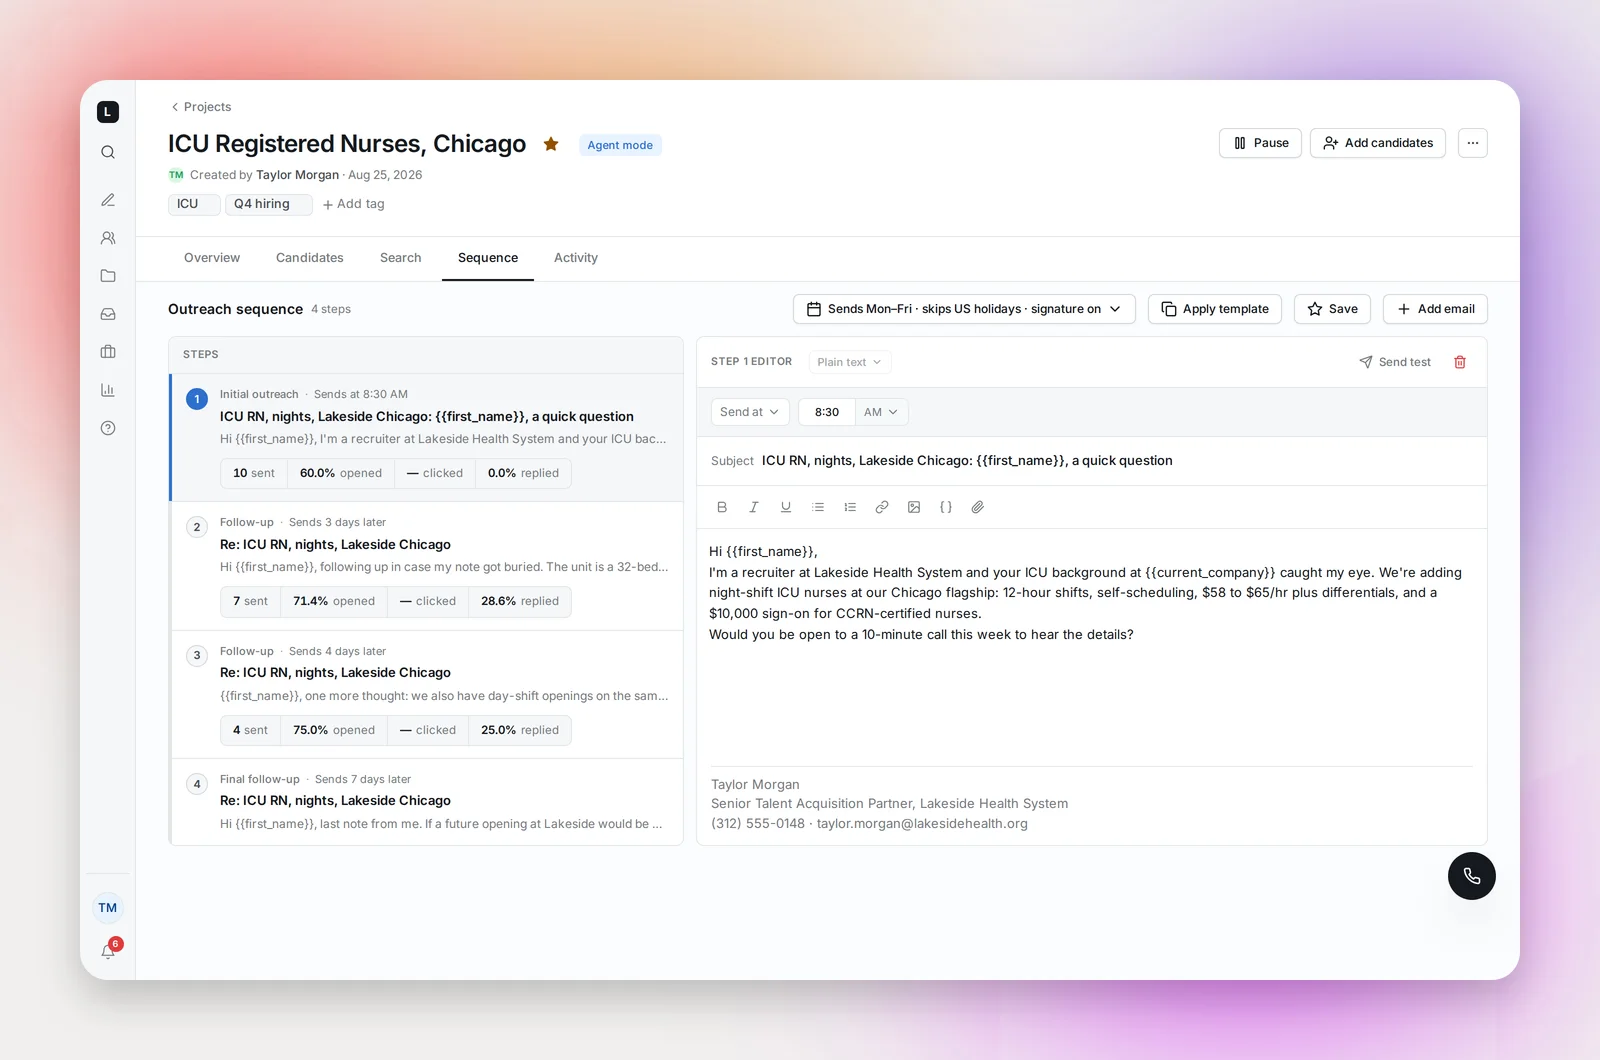
- On the Sequence tab, each step shows sent, opened, clicked and replied, so you can see which email is doing the work.
- On the Candidates tab, the eye icon shows how many times a candidate opened each step, and the Sequence filter isolates Opened or Replied.
- The Activity tab is the timeline: sourcing, sends, opens, clicks, replies and agent actions, grouped by day, with a "Most engaged" list.
Reading the numbers
Opens are detected when the email's images load, so a mail client that blocks images under-counts opens and one that pre-loads them can over-count. Treat open rate as a trend, not a census; replies are the number that matters.
Frequently asked questions
Why is the Projects page number different from the Overview?
The Projects page counts people once across the whole project; the Overview respects the date range you chose.
Where do I see performance across all projects?
Admins have Insights: emails sent, opened and replied per recruiter and team. See Insights and PDF Export.
Do test emails count?
No. Sends to yourself from Send test aren't part of the project's metrics.